
A colour schlieren visualization of a supersonic jet with sound-suppressing tabs at the nozzle.
Students: Jens Kanje, Nicholas Johnston
Students: Jens Kanje, Nicholas Johnston

A colour schlieren visualization of a supersonic jet from an aerospike nozzle.
Students: Jens Kanje, Ryan Brunet, Joshua Lynch
Students: Jens Kanje, Ryan Brunet, Joshua Lynch

A colour schlieren visualization of a supersonic jet.
Students: Jens Kanje
Students: Jens Kanje
A colour schlieren visualization of a supersonic jet with sound-suppressing chevrons at the nozzle.
Students: Jens Kanje, Nathan Humphrey
Students: Jens Kanje, Nathan Humphrey

A schlieren image of the transverse density gradient for a supersonic impinging jet.
A colour schlieren visualization of a supersonic jet with sound-suppressing chevrons at the nozzle.
Students: Jens Kanje, Nathan Humphrey
Students: Jens Kanje, Nathan Humphrey

Schlieren image of the axial density gradient of flow into a Hartmann-Sprenger tube.
An HS tube creates an incredibly powerful acoustic resonance. This resonance can be so powerful that it even superheats the air inside the tube to 900 degrees in a matter of seconds!
Students:Nicholas Mason-Smith, Corey Leb
An HS tube creates an incredibly powerful acoustic resonance. This resonance can be so powerful that it even superheats the air inside the tube to 900 degrees in a matter of seconds!
Students:Nicholas Mason-Smith, Corey Leb

Schlieren image of twin supersonic jet impingement.
Student: Marcus Wong
Student: Marcus Wong
A time averaged transverse density gradient of a highly underexpanded supersonic jet. A large Mach disk is visible at the first shock cell.

Fluctuations in transverse density gradient for a supersonic nozzle with noise suppressing chevrons.
The brightness of each point indicates how much fluctuation in density gradient was observed at that point (brighter means more fluctuation)
Student: Nathan Humphrey
The brightness of each point indicates how much fluctuation in density gradient was observed at that point (brighter means more fluctuation)
Student: Nathan Humphrey

Fluctuations in axial density gradient for a supersonic nozzle with noise suppressing chevrons.
The brightness of each point indicates how much fluctuation in density gradient was observed at that point (brighter means more fluctuation)
Student: Nathan Humphrey
The brightness of each point indicates how much fluctuation in density gradient was observed at that point (brighter means more fluctuation)
Student: Nathan Humphrey

Time averaged transverse density gradient for a supersonic nozzle with noise suppressing chevrons.
Student: Nathan Humphrey
Student: Nathan Humphrey

Fluctuations in transverse density gradient for a supersonic nozzle with noise suppressing chevrons.
The brightness of each point indicates how much fluctuation in density gradient was observed at that point (brighter means more fluctuation)
Student: Nathan Humphrey
The brightness of each point indicates how much fluctuation in density gradient was observed at that point (brighter means more fluctuation)
Student: Nathan Humphrey

Time averaged density gradient for a supersonic nozzle with noise suppressing chevrons.
Student: Nathan Humphrey
Student: Nathan Humphrey

Transverse density gradient for a supersonic nozzle with noise suppressing chevrons.
Student: Nathan Humphrey
Student: Nathan Humphrey

Fluctuations in axial density gradient for a supersonic nozzle with noise suppressing chevrons.
The brightness of each point indicates how much fluctuation in density gradient was observed at that point (brighter means more fluctuation)
Student: Nathan Humphrey
The brightness of each point indicates how much fluctuation in density gradient was observed at that point (brighter means more fluctuation)
Student: Nathan Humphrey

Fluctuations in transverse density gradient for a supersonic nozzle with noise suppressing chevrons.
The brightness of each point indicates how much fluctuation in density gradient was observed at that point (brighter means more fluctuation)
Student: Nathan Humphrey
The brightness of each point indicates how much fluctuation in density gradient was observed at that point (brighter means more fluctuation)
Student: Nathan Humphrey

Axial density gradient for a supersonic nozzle with noise suppressing chevrons.
Student: Nathan Humphrey
Student: Nathan Humphrey

Fluctuations in axial density gradient for a supersonic nozzle with noise suppressing chevrons.
The brightness of each point indicates how much fluctuation in density gradient was observed at that point (brighter means more fluctuation)
Student: Nathan Humphrey
The brightness of each point indicates how much fluctuation in density gradient was observed at that point (brighter means more fluctuation)
Student: Nathan Humphrey

Transverse density gradient for a supersonic nozzle with noise suppressing chevrons.
Student: Nathan Humphrey
Student: Nathan Humphrey

Fluctuations in axial density gradient for a supersonic nozzle with noise suppressing chevrons.
The brightness of each point indicates how much fluctuation in density gradient was observed at that point (brighter means more fluctuation)
Student: Nathan Humphrey
The brightness of each point indicates how much fluctuation in density gradient was observed at that point (brighter means more fluctuation)
Student: Nathan Humphrey

Fluctuations in transverse density gradient for a supersonic nozzle with noise suppressing chevrons.
The brightness of each point indicates how much fluctuation in density gradient was observed at that point (brighter means more fluctuation)
Student: Nathan Humphrey
The brightness of each point indicates how much fluctuation in density gradient was observed at that point (brighter means more fluctuation)
Student: Nathan Humphrey

Fluctuations in axial density gradient for a supersonic nozzle with noise suppressing chevrons.
The brightness of each point indicates how much fluctuation in density gradient was observed at that point (brighter means more fluctuation)
Student: Nathan Humphrey
The brightness of each point indicates how much fluctuation in density gradient was observed at that point (brighter means more fluctuation)
Student: Nathan Humphrey

Transverse mean density gradient for a supersonic nozzle with noise suppressing chevrons.
Student: Nathan Humphrey
Student: Nathan Humphrey

Schlieren of a supersonic jet. The Mach wave radiation and sound production are both visible.
Fluctuations in transverse density gradient for a supersonic jet.
The brightness of each point indicates how much fluctuation in density gradient was observed at that point (brighter means more fluctuation)
The brightness of each point indicates how much fluctuation in density gradient was observed at that point (brighter means more fluctuation)

Fluctuations in density gradient for a supersonic nozzle with noise suppressing chevrons.
The brightness of each point indicates how much fluctuation in density gradient was observed at that point (brighter means more fluctuation)
Student: Nathan Humphrey
The brightness of each point indicates how much fluctuation in density gradient was observed at that point (brighter means more fluctuation)
Student: Nathan Humphrey

Schlieren image of the transverse gradient of a supersonic impinging jet. Impingement plate is to the right of the image edge.

Mean transverse density gradient for a supersonic nozzle with noise suppressing tabs.
Student: Nick Johnston
Student: Nick Johnston
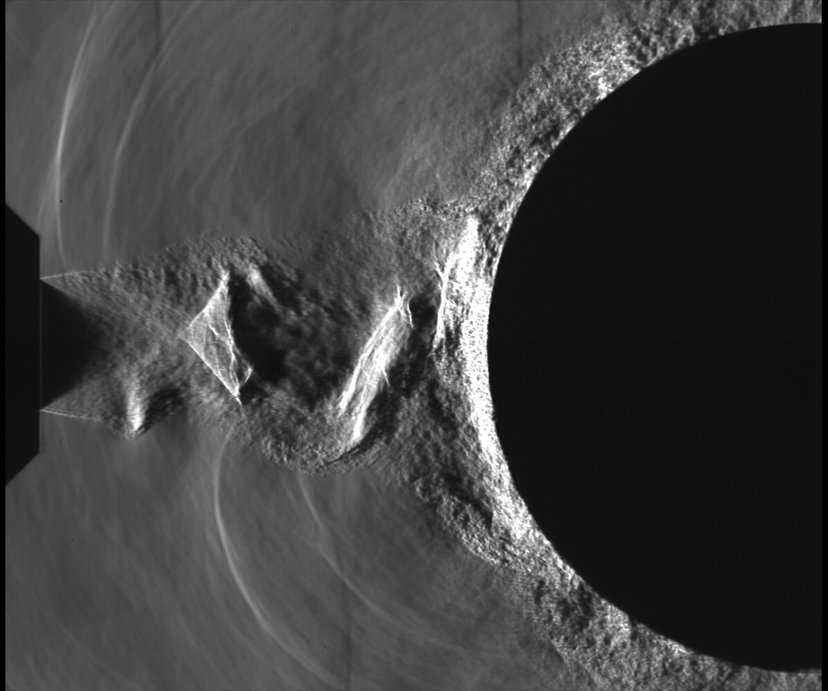
Instantaneous schlieren image of axial density gradient for supersonic jet impinging onto a cylinder. Acoustic waves are visible as thin curved white lines travelling back to the nozzle.
Student: Nick Mason-Smith
Student: Nick Mason-Smith